
How to Survey Amazon Wildlife
On this page we provide resources for teachers and students on how to survey Amazon wildlife, and how to work on real data sets to analyse actual results. Information includes a text background to each vertebrate group, ID, methods and data sheets, and an excel spread sheet with actual data that you can analyse.
Table of Contents
1. Introduction
2. Research Design
3. Habitat types and seasons
4. Dolphins
5. Fish
6. Shorebirds
7. Caimans
8. Bats
9. Frogs
10. Macaws
11. Terrestrial Mammals
INTRODUCTION and RESEARCH DESIGN
Wildlife research on aquatic, terrestrial, and arboreal species in the Peruvian Amazon helps us understand better the ecology of species, the impact of climate change, and advances in sustainable use, community-based conservation, one-health, and the emerging green economy. The field research provides the science base for 1) sustainable resource use and community-based conservation, 2) impacts of climate change on biodiversity and people, 3) disease risks, and 4) wildlife trade and recovery of endangered species. The research studies on all the vertebrate groups and includes the ecology of dolphins, fish, frogs, shorebirds, macaws, primates, ungulates, carnivores, caimans, and lizards. Population trends are recorded for all species, and specific ecological questions vary among the different vertebrate groups.
HABITAT TYPES AND SEASONS
The principal habitat types of the Peruvian Amazon are a result of large-scale geological changes that occurred during the tertiary and quaternary periods. The Yarapa River basin is situated in the Pevas lake bed that formed after the uplifting of the Andes. When the Pevas Lake drained it left a geological depression in this area of western Amazonia, the Ucamara depression, which is currently characterized by alluvial soils.
The wildlife of the Yarapa River lives in an ecosystem that is characterised by large seasonal fluctuations occurring between the high water and low water seasons. The ecology of the aquatic and terrestrial wildlife revolves around these seasonal changes in water level.
The large seasonal inundations that annually occur along the immense floodplains of the Amazon river are a result of rainfall in the foothills of the Andes. During the summer months of October to May precipitation off the southern Atlantic Ocean results in heavy rainfall on the eastern Andes that runoff into the western Amazon basin. The result is large scale flooding along the major rivers situated in the flooded forests in the high-water season. In contrast, during the winter months of June to September the precipitation off the southern Atlantic Ocean decreases and the rain in the eastern Andes is greatly reduced, resulting in the drying up of the western Amazonian rivers and the low water season.
In the link below there is an example data file that has daily river water level for three years. The first year, 2012, was a historically high flood in the high-water season. The second year, 2019, was a normal year, and lastly, 2023, was a historic drought in the low water season. The river level data are listed by day of the year and are meters-above-sea-level.
You can practise analyzing the spread sheet. Make graphs of the three years to see the difference in water levels between intensive floods, normal years and droughts. Can you find the peaks and troughs of each year?
RIVER DOLPHINS
Two species of river dolphins, Inia geoffrensis (pink dolphins) and Sotalia fluviatlis (grey dolphins), inhabit the rivers of the Yarapa study site. Here we provide a set of resources on studying the Amazon river dolphins, including a text on our recent dolphin studies, an ID sheet, a methods sheet, and an excel data sheet to practice analyses.
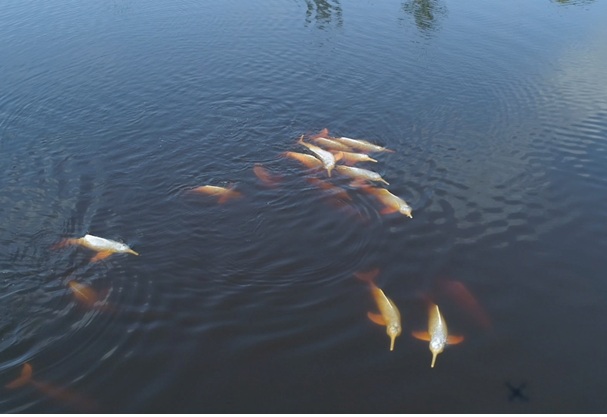
Two sympatric river dolphin species, Inia geoffrensis (pink river dolphin) and Sotalia fluviatilis (grey river dolphin), inhabit flooded forests and rivers in the Ucamara depression of western Amazonia in Peru [6]. Pink river dolphins, an ancient species, use smaller tributaries and flooded forests, but also use large rivers [7,8]. They have evolved adaptations for the Amazon and flooded forests since the Miocene, around twenty million years ago [9]. Grey river dolphins split from their marine ancestors around two million years ago during the Pleistocene and are less adapted to flooded forest life; they inhabit larger rivers and occasionally smaller tributaries and flooded forests [10,11].
In this study, we used a long-term data set collected monthly over 15 years at multiple areas with dolphin aggregations. This paper analysed the data set to better understand the ecology of Amazon River dolphins in relation to their fish prey and shows how aggregation sites at confluences are central to the life history of dolphins. We used an experimental design that recorded dolphin and fish data at the confluences and at control sites outside of these areas. We studied areas where pink and grey river dolphins aggregate in terms of dolphin numbers and interactions, fish numbers and diversity, and riverbed geomorphology.
The study sites included the aquatic landscape at the confluence of the Ucayali, Maranon, and Amazon Rivers, and the confluences of the Samiria River in the Pacaya–Samiria National Reserve. The Pacaya–Samiria National Reserve, decreed in 1982, is currently co-managed between the Peruvian Protected Area Service (SERNANP) and the Cocama (Kukama) Indigenous people through community-based management groups. The reserve allows sustainable resource use and traditional activities, including artisanal fishing [17]. This area is part of the largest block of várzea flooded forests in western Amazonia and extends over an area of 120,000 km2 in the Department of Loreto, Peru [18].
The pink river dolphin and the grey river dolphin are both classified as “Endangered” (EN) in the IUCN Red list, which shows their vulnerability to ongoing conservation threats [19]. Dolphin studies in the Pacaya–Samiria National Reserve and adjoining areas span over decades [5,7,20] and the population of both river dolphins is particularly Fishes 2025, 10, 495 3 of 19 abundant in this region and has been stable over the years [18]. The local Indigenous communities and SERNANP are both important to dolphin conservation at confluence sites. Indigenous communities in this region of the Peruvian Amazon have strong beliefs about not killing the dolphins, and this has been key in maintaining strong dolphin populations, especially at confluence areas where there are dolphin aggregations [21].
The dolphin example that we provide uses a line transect method from a boat. Dolphins are recorded visually when breaching the water surface. Species are identified as either pink river dolphins or grey river dolphins. The number of dolphins present is determined by observing the individual or pods for as long as possible. Data are recorded as the number of individuals, not the number of breaches, so great care must be taken not to double count individuals. Visual tracking of the animals is used to determine how many individuals are present. The GPS point of the river location is recorded for each dolphin sighting, together with the distance along the transect. Pod composition is recorded in three broad categories, including infant/young individuals, juvenile/sub-adult individuals and adults. Behavioral data are recorded in categories of feeding, moving, resting, playing and mating.
Read the full methods in the link below, which includes the description of the methods, the data sheet used to record the dolphin observations, and an ID plate with species descriptions.
Below is the dolphin data for 2019 in an excel pivot table. It was collected in the Yarapa study sites that include the smaller Yarapa River and the large rivers of the Ucayali, Maranon, and Amazonas. The data includes the survey location, the number of pink and grey dolphins counted (pod size), the age composition (B=infant, J= juvenile/subadult, A= adult), the behavior (fishing, resting, moving, playing), and GPS point,
The dolphins only use the Yarapa river during the high water season, and they move out to the larger rivers when the water level drops in the low water season. The dolphins use the large river (Ucayali, Maranon, Amazonas) all year around.
Make some graphs of the pink and grey dolphin population size. We usually use an abundance value of number of dolphin individuals per kilometer of river (ind/km). The survey lengths vary, so it is better to use ind/km instead of ind/survey. Densities can be estimated using a fixed width of 50m on the Yarapa River, and 100m on the larger rivers. Fixed width density is the number of dolphins divided by the area as length x width of the line transect that gives you ind/km2.
Use the data set to analyse the difference in pink and grey dolphin behavior, group sizes, and age categories.